Descriptive vs inferential statistics: an overview
Posted on 9th January 2024 by Carolina Guadalupe Cruz Muñoz

‘Biostatistics is the discipline concerned with the treatment and analysis of numerical data derived from biological, biomedical, and health-related studies’ (Gerstman B.B., 2015).
Three aspects of biostatistics relevant to this blog are:
- Sampling, which consists of selecting the sample (a subset or a part of the population that is the object of the study). Read this blog by Mohamed for some clear examples of sampling methods.
- Descriptive statistics: the summary of the data we obtained from the chosen sample.
- Inferential statistics: analysis of the data we obtained from a sample with the aim of generalizing this to a larger population.
Descriptive statistics
Descriptive statistics involves describing the data from our selected sample. Before explaining how this is done, I’d like to ask you: how would you describe this image?
Photo by user leebevan on Freeimages.com
When we describe something, we mention its features and characteristics: how big it is, what colour it is, how old it is, or how it looks.
Descriptive statistics tries to do something similar: it involves choosing a sample (or group) you are interested in, recording information about it, and then using summary statistics to describe its properties or characteristics. These characteristics of the sample are called variables. Some examples of variables are gender, temperature, height, serum blood glucose, etc. Just as Alyssa mentions in her post, they can be classified in nominal, ordinal, or numerical variables.
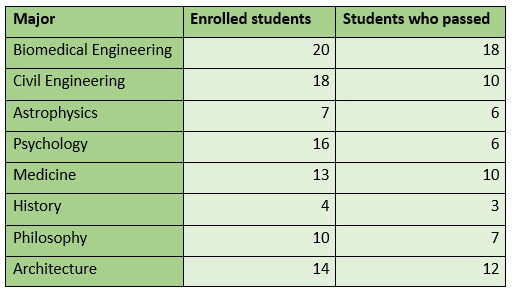
We can use data tables to describe the sample and the variables we are interested in. The following is an example of a data table. It describes the number of students from various majors who enrolled in a class and how many of them passed the class. Note that there is no attempt to draw conclusions here about a larger sample. The aim is simply to describe the data from the sample you have.
Once the data have been arranged in a table, descriptive statistics also makes use of graphics.
Finally, as a way of synthesizing all this prior information, descriptive statistics uses measures of central tendency (mean, median and mode) and measures of variability such as range, quartiles, variance and standard deviation. These measures can give us an overview of our sample.
You can learn more about these methods in 3 blog posts by Tarik: Measures of central tendency, Measures of variability part 1, and Measures of variability part 2.
Inferential statistics
Now, the previous information can help us describe a sample but in the biomedical field we do not aim to treat just samples: we want to include and, if possible, treat the larger population from which the sample was drawn. But is it possible to perform a study with thousands or even millions of individuals? Of course not! Fortunately, inference comes to the rescue. The purpose of inferential statistics is to extrapolate the results of our sample to the relevant wider population. In other words, it generalizes the information.
To be able to make accurate generalizations, our sample needs to accurately represent the larger population. To achieve this, it is important to have a random sample.
Let’s look at three forms of statistical inference:
- Point Estimation: we apply this when we estimate a parameter using a number from our sample. For example, we might carry out a survey with a sample of people and use the data to estimate the proportion of the population from a certain country that drink soft beverages every day.
- In Interval Estimation we use confidence intervals, which you may have heard of. You can learn more about them in this blog from Jessica. Long story short, interval estimation consists of estimating an unknown parameter using a range of values from our sample. For example. “Between 85-90% of patients with HPV-related neoplasia (abnormal cell growth) are female at birth (Confidence Interval of 95%)”. This means that if we make a survey/experiment in order to compare the sex assigned at birth of those with this type of neoplasia, 95% of the time, we’d expect 85-90% of the sample to be female. (Invented data in order to give an example).
- Hypothesis Testing, is where we use sample data to test a claim (or hypothesis) about the wider population and we draw conclusions about the population based on the results. For example, in a study where a new treatment is compared to the gold-standard, we draw conclusions about effectiveness and safety. You can learn more from this blog written by Ashline.
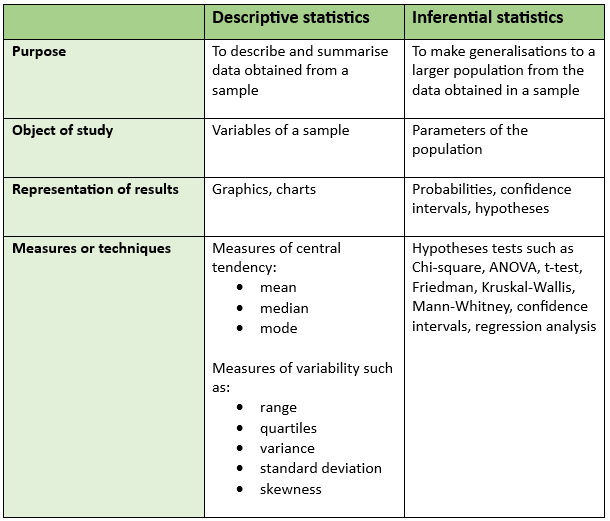
In summary, here is a chart showing the main differences between descriptive and inferential statistics and some questions to test your understanding.
LEGGI TUTTO https://s4be.cochrane.org/blog/2024/01/09/descriptive-vs-inferential-statistics-an-overview/